How to outline regions of a structure in ChimeraX
Table of Contents
Inspiration
Recently, I was reading Reliable protein-protein docking with AlphaFold, Rosetta and replica-exchange by Harmalkar, Lyskov, and Gray. I noticed their figures have a clever approach to highlighting structural regions of interest for the reader. Some examples below:
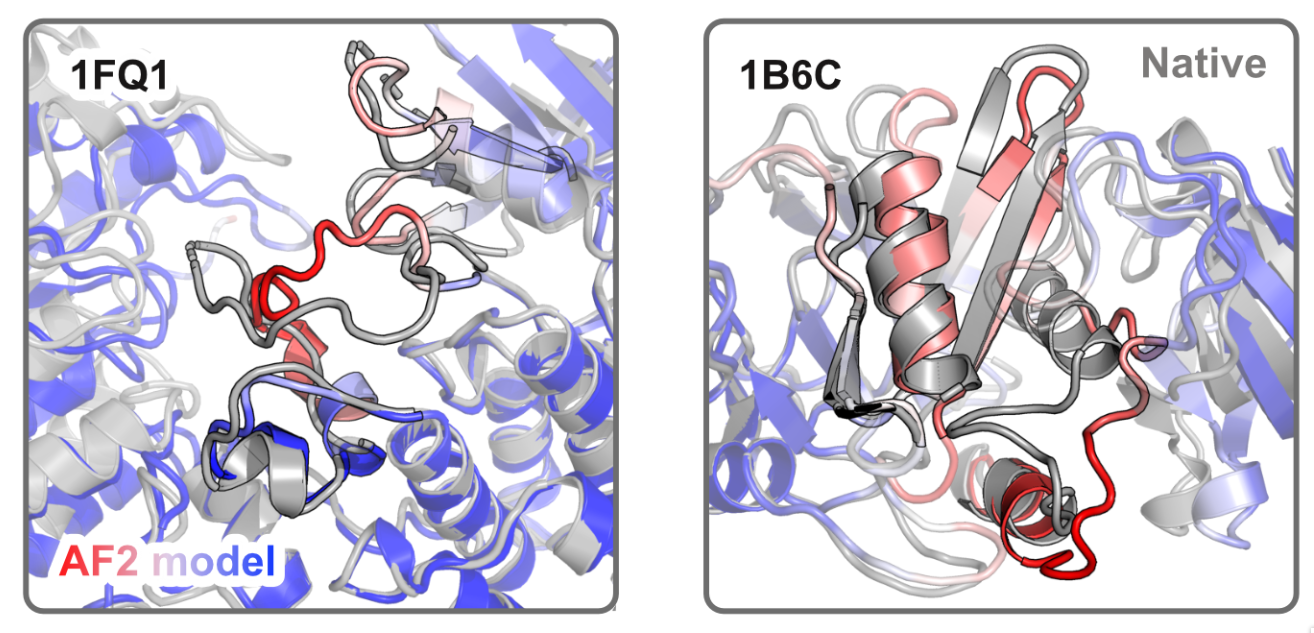 Highlighting conformational differences between experimental structure and AF2 model
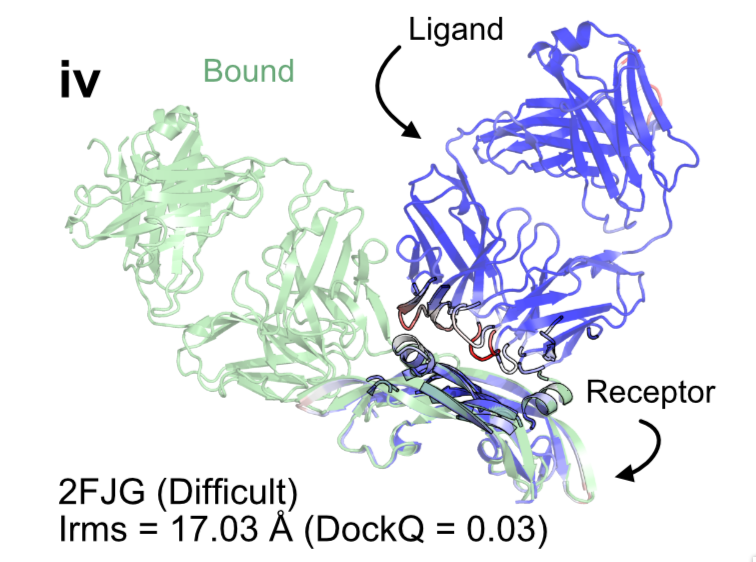 Highlighting interacting surfaces
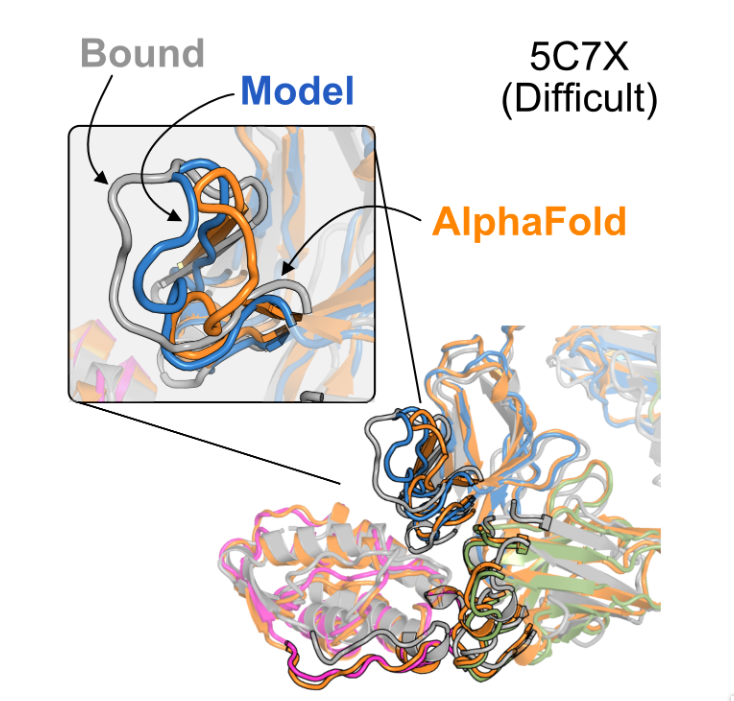 Highlighting conformational differences
I thought the use of using transparency on non-outlined regions in combination with using outlines around opaque regions was a good way to draw the readers attention towards parts of the structure you want to emphasise. It’s especially effective for visualising structural comparisons between two or more similar structures (as this paper does).
I wanted to replicate this in the UCSF ChimeraX software for myself. Unfortunately, it wasn’t immediately clear how to achieve this. I thought it had something to do with changing the ‘Silhouette’ setting in ChimeraX (the outlines above look very similar to silhouettes, after all). This was a red herring; the answer lied in the “graphics” setting. This short blog post is my attempt to clarify how to do this.
ChimeraX commands for region-specific outlines
- Set ‘silhouettes’ off
- Select residues of interest (with mouse or highlighting sequence in Sequence Viewer panel)
- In the command line field:
graphics sel col black width 3
The selected region will now look as though it has a silhouette outline, while the rest of the structure does not. We can go even further by altering the transparency:
trans #1 50 target ac– sets the transparency of structure #1 to 50% on cartoons and atoms- Select residues of interest
graphics sel col black width 3trans sel 0 target ac– sets the transparency of the selected region to 0% (i.e. opaque)
This is really useful for highlighting structural similarity between two (or more) structures. For example:
- Open two structures of interest
mm #2 to #1 showAlign t– aligns the two structures with the “matchmaker command” and shows the sequence alignment paneltrans #1,2 50 target acgraphics sel col black width 3trans sel 0 target ac
Here’s a structural superposition figure I made comparing the similarity between two proteins. The point I wanted to highlight was that only the enzymatic “core” of these proteins are structurally similar.
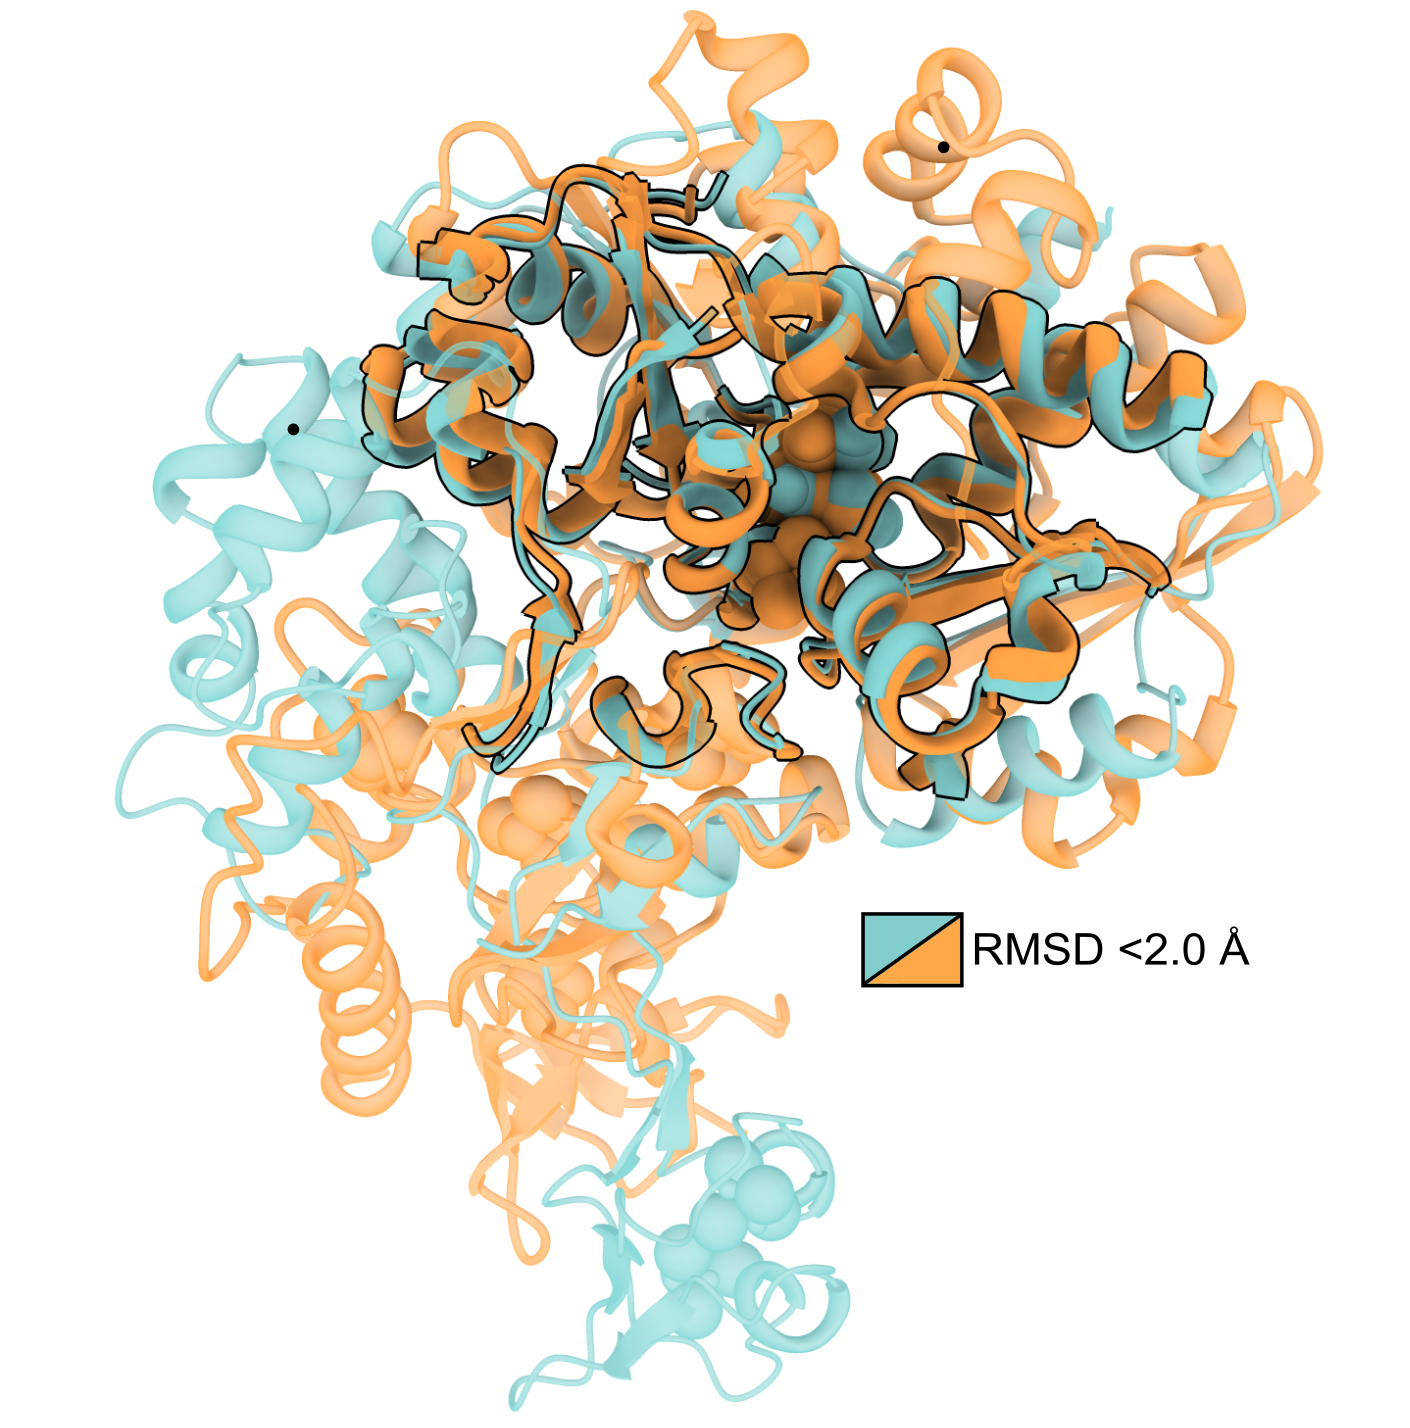 Highlighting regions of shared structural similarity between two proteins
Other potential uses
It’s worth pointing out that the colour of the outline doesn’t have to be set to black, it can be set to any colour you
like.
Something I’ve had fun playing around with is setting graphics sel col to match the colour of the proteins surface
(e.g. teal) and select the entire model.
This will create an outline (or halo, if you will) around the protein surface.
I think this looks much more pleasing than a standard black silhouette when turning the transparency of the surface up
with trans #1 80 target s.
It’s also possible to have silhouettes on the cartoons and atoms of the protein underneath the transparent surface by
setting graphics sil t depthJump 0.2.
This will essentially make the silhouette lines invisible on the contours of the protein
surface, while keeping the silhouettes visible on the cartoons and atoms underneath.
Here’s an example of what that looks like:
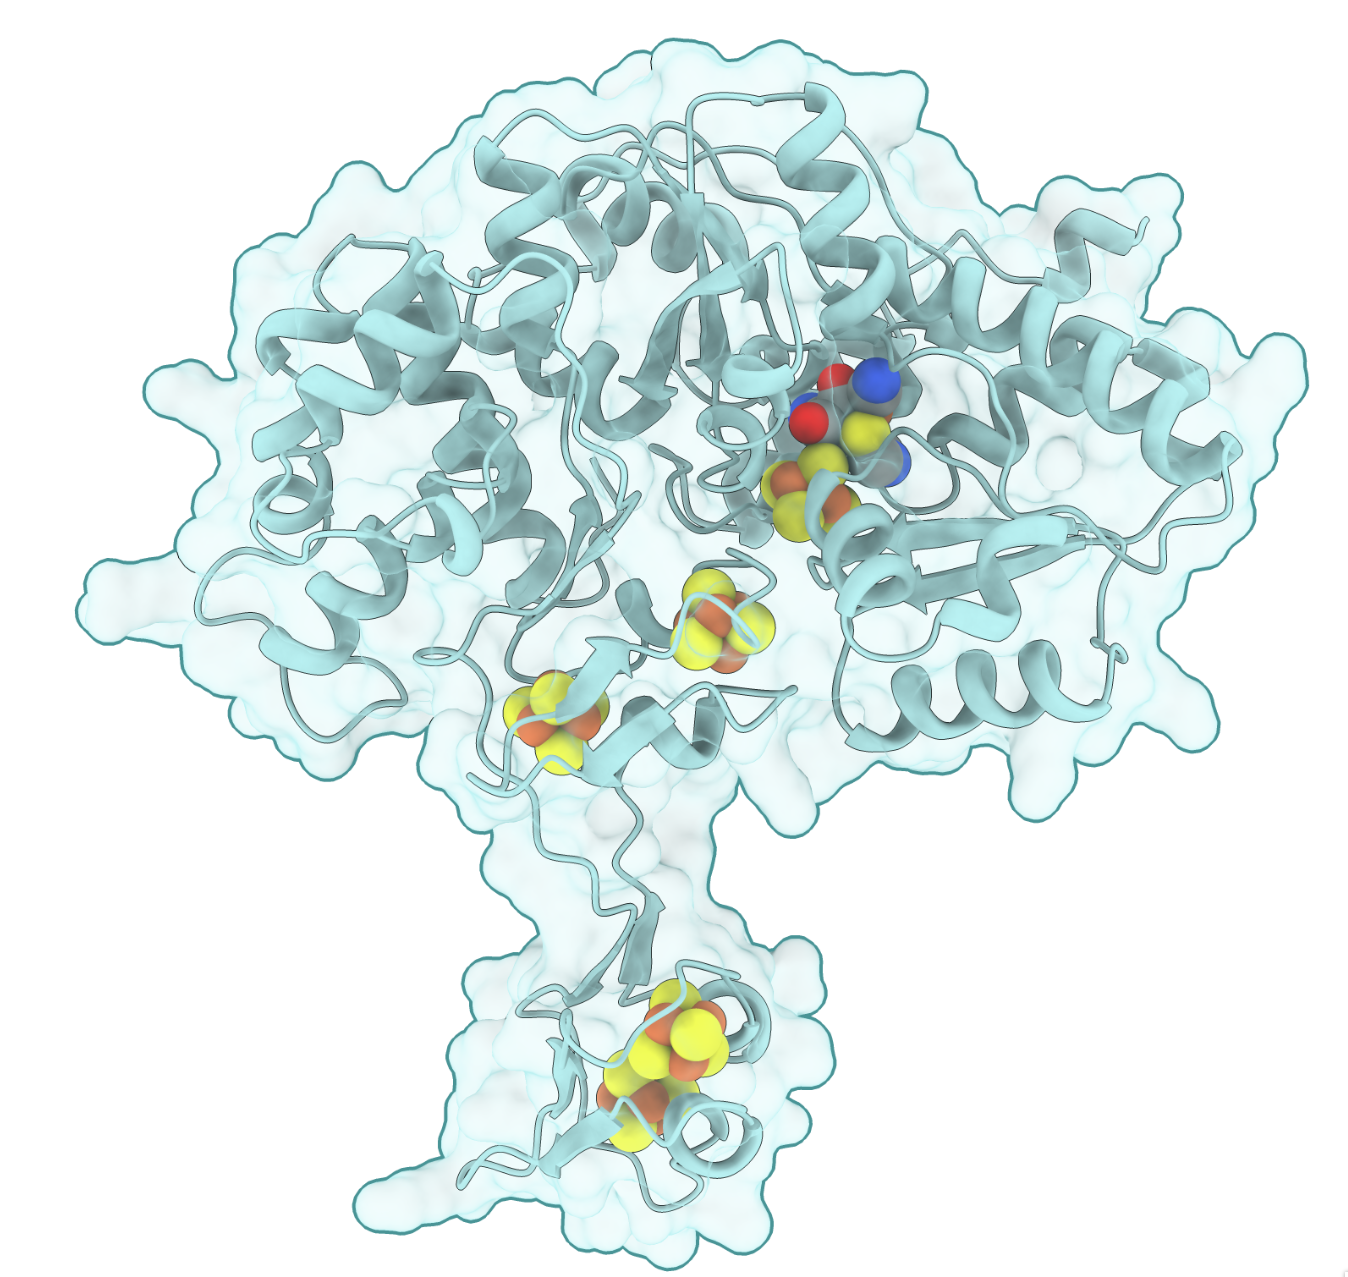 A screenshot from ChimeraX
Pretty neat.