How to visualise protein cavity surfaces in ChimeraX
Table of Contents
Displaying the surfaces of cavities and voids inside proteins with ChimeraX (v1.8) is not straightforward. There are a few options though.
Showing a cavity surface around a native ligand
Let’s use Complex I as an example, as it contains a large cavity within the junction of three subunits (the quinone binding cavity between NuoH, NuoD, and NuoB). We’ll use the quinone bound Complex I structure from T. thermophilus first.
open 6I0D

# view only one multimer
sym #1 assembly 1

# view the subunits containing the quinone site
view #2.1/H,C,B

# basic stylistic settings
show cartoon
style stick
hide atoms
show ligand
lighting soft
trans 70 target c
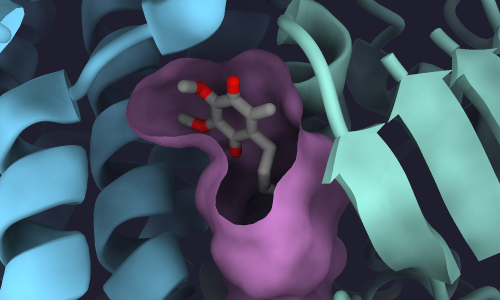
To show the cavity surface of the quinone-binding pocket, we have to define an area near where we think a cavity will be.
One way to do this is to select protein atoms within the vicinity of a ligand buried inside the protein.
In the case of this Complex I structure, the ligand of interest is a quinone molecule.
This quinone is encoded in the PDB file with the non-standard residue code :DCQ.
This command shows the surface of all atoms (@) within 10 Å (<10) of the quinone (:DCQ).
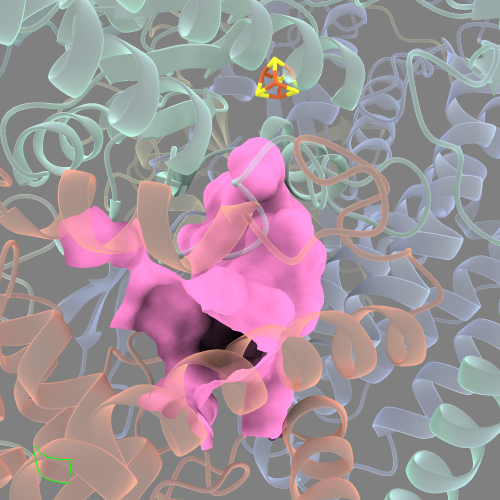
surface #2.1:DCQ @<10
There are a number of smaller disconnected cavities surrounding the main cavity that look like small “blobs”.
This is not ideal because we want to visualise the quinone-binding cavity alone.
To do this, we can rerun the command but specify we only want to see the N number of largest surfaces with the visiblePatches options.
surface #2.1:DCQ @<10 visiblePatches 1
It looks a bit cleaner, but there’s still the issue of that the cavity surface looks like it’s “torn” at the edges.
This is because we are still visualising the cavity as three separate surfaces from each of the three subunits surrounding the quinone.
To make a single surface, we need to specify which protein surfaces to joing together with the enclose option.
surface #2.1:DCQ @<10 visiblePatches 1 enclose /4,6,H
# Note: /4,6,H are the chain ID's of interest
Now the cavity surface is a single smooth surface. It will also be listed with it’s own ID under the “Models” side-window of ChimeraX (in this case it’s listed as “Surface #2.1/4,6,H”). This will come in handy later on.
If you take a look at this cavity surface from different angles, you’ll see that there will be “gaps” where the surface hasn’t filled in.
This is because 10 Å isn’t a sufficient radius from :DCQ to reach the edges of the entire cavity.
We can extend this distance until we are happy that we’ve captured the full surface of the cavity.
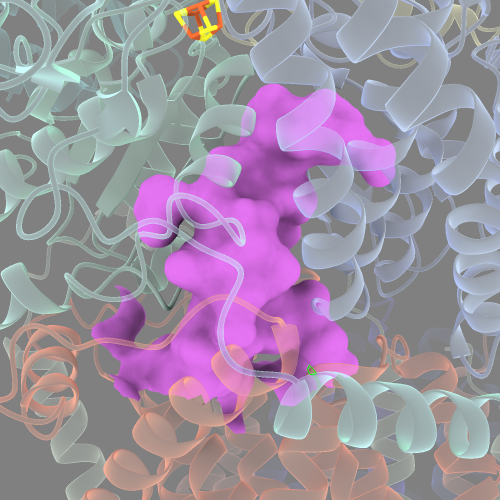
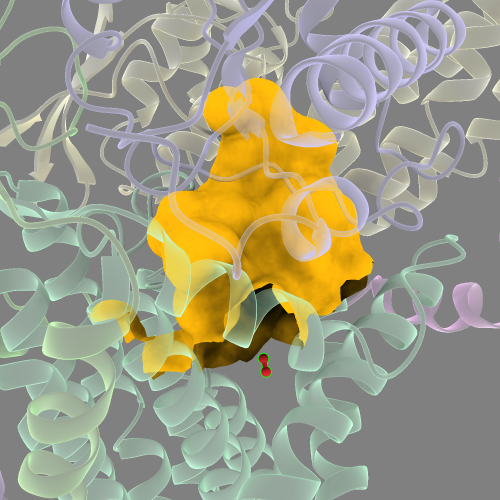
surface #2.1:DCQ @<15 visiblePatches 1 enclose /4,6,H
This looks like a more complete cavity surface. However, extending the radius beyond 15 Å results in the surface extending outside of the cavity to the protein exterior. I will describe one way to get around this limitation below (see the third section).
But for now, what if we use a different probe size with the probeRadius option to visualise the cavity?
The default probe radius size is 1.4 Å, which is approximately the radius of a water molecule.
This small probe size results in a large and “lumpy” cavity surface area.
Maybe we could increase this probe radius size closer to the size of the quinone head group to reflect how the quinone has restricted space to move inside the cavity?
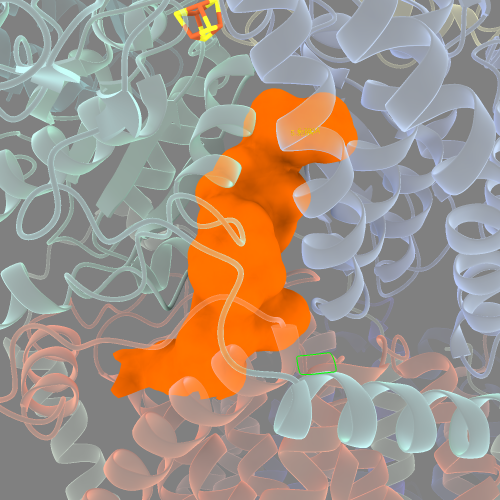
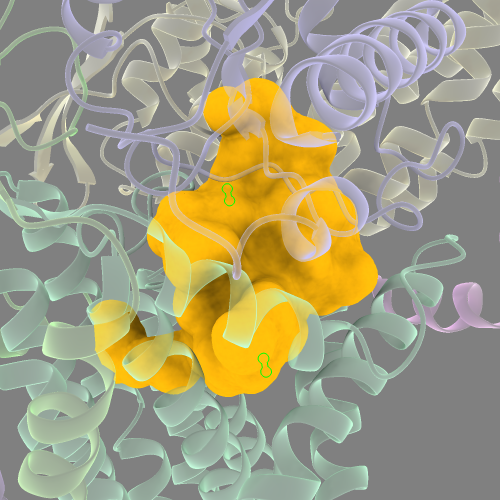
surface #2.1:DCQ @<15 visiblePatches 1 enclose /4,6,H probeRadius 2.0
probe radius of 1.4:
probe radius of 2.0:
Showing a cavity surface when there is no native ligand
What if you want to show a cavity surface when there is no ligand to start from? For example, in an apo structure of Complex I? One way to achieve this is to manually select some residues at the cavity surface and use:
surface sel @<10 visibleP 1
However, this requires a lot of trial and error in my experience and is quite tedious. A better way to do this is to cheat by importing ligands into the cavity of interest.
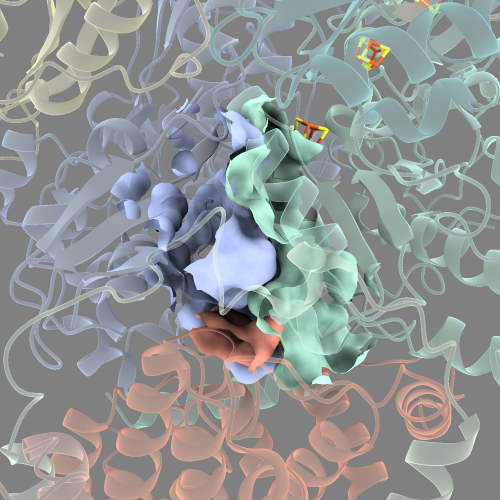
Let’s use the non-quinone binding Complex I-like protein, MBH, as an example.
open 6CFW
Now, import a small molecule from PubChem. Let’s use dinitrogen (N2), which has the PubChem ID of 947.
open pubchem:947
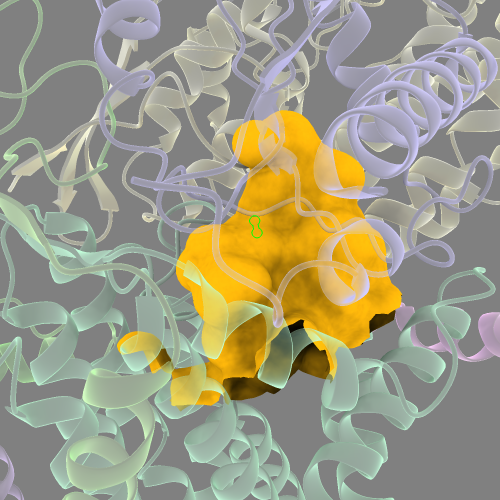
Select it, and then with the “move atoms” tool under the right mouse tab, manually move N2 into the approximate position of the MBH cavity (between subunits H, J, and L, which are homologs of the Complex I subunits discussed previously). Once you’re happy with its position, and making sure N2 is still selected/highlighted, run:
surface sel @<15 visibleP 1 enclose /M,J,L probeRad 2.0
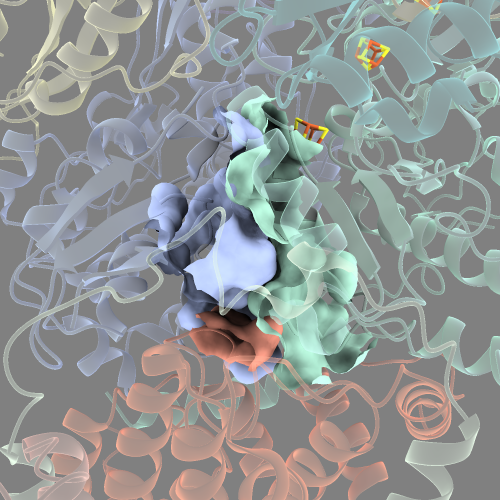
Using multiple imported ligands to capture the entire cavity surface
As seen above in both our MBH cavity and Complex I cavity, we haven’t captured the entire cavity surface. There are still “holes” in these cavities. In many cases, this is unavoidable for cavities that aren’t closed off from the surrounding solvent. That said, we can still capture more of the cavity surface area by simply moving multiple ligands into the cavity area and iteratively repeating the command until we’re happy with the visual.
# open another copy of dinitrogen
open pubchem:947
Move the new N2 into the approximate position within the cavity like so:
And with both N2 molecules selected, run:
sur sel @<15 visibleP 1 enclose /M,J,L probeRad 2.0
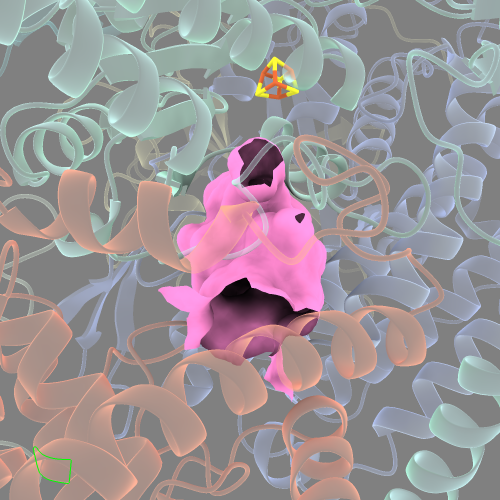
Repeat this process until you’re satisfied.
It’s a little tedious, but ChimeraX gives you enormous control over how to depict a surface.
Note: playing around with the distance from the ligand (i.e. the @<15 option part of the command) is necessary to get the desired cavity visual.
Making the distance too small results in an incomplete cavity surface and may require additional imported ligands as described above.
But making the distance too large (e.g. @<20 in the case for these example proteins) results in the surface “jumping” from the protein cavity to the protein exterior.
This seems to be a quirk of how the surface command in ChimeraX is programmed, so keep these details in mind.
Colouring a cavity surface by electrostatics or lipophilicity
The surfaces generated using the commands above creates a surface model, which allows you to run other commands on it. For example, you can colour the cavity surface anyway you like and set the surface transparency.
col #<SURFACE_ID> <color_name>
trans #<SURFACE_ID> 50 target s #this sets transparency to 50%
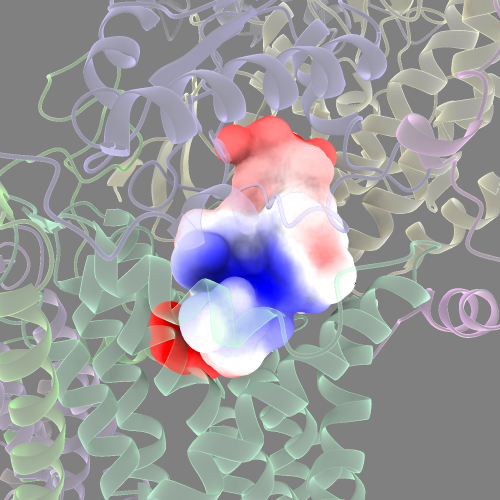
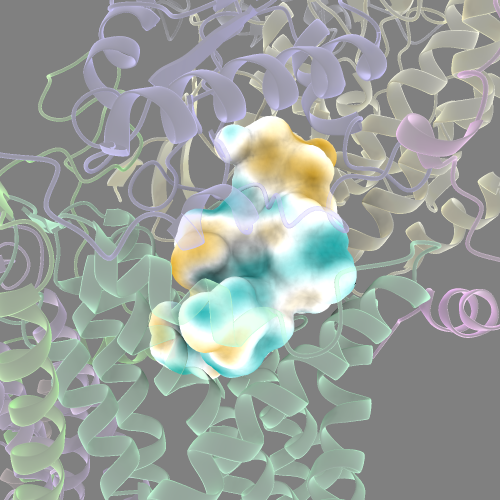
You can also colour the cavity surface by it’s electrostatic potential or lipophilicity.
#for electrostatics
coulombic surfaces #<SURFACE_ID>

#or lipophilicity
mlp sur #<SURFACE_ID>
Measure cavity surface area and volume
Another useful feature of ChimeraX is that it can measure the volume (in Å3) and area (in Å2) of any surface. Go to Tools ==> Volume Data ==> Measure Volume and Area. This opens a new window with a drop down menu of different surface selections. Now you can compare cavity sizes between different proteins if you were interested in such a question.